It has been two months since we last looked at the impact SARS-CoV-2 has had on the online purchasing behaviors of life science researchers. At the beginning of April, which feels like a lifetime ago, the impact that the patchwork of “shelter in place” orders was having on the traffic to Biocompare was clear; visits to the site dropped significantly the last two weeks of March. That trend continued through the month of April but the outlook improved in May with some geographical caveats.
Total Visits to the Biocompare website were up year over year during the first two weeks of March. But that trend reversed sharply beginning March 16 and continued that way for the first part of April.
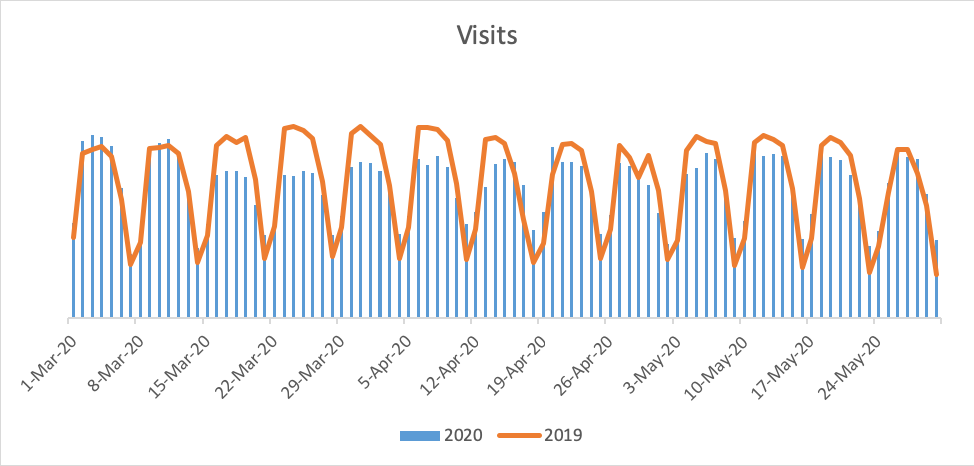
Year over year traffic for April 1–15 was down 9%; the second half of April saw a year over year (YoY) decrease of 4%. This 4% YoY decrease continued through the first half of May. But from May 15–31 there was a 5% increase in YoY traffic, indicating that we may be turning a corner when it comes to user activity.
As before, there are geographical patterns emerging:
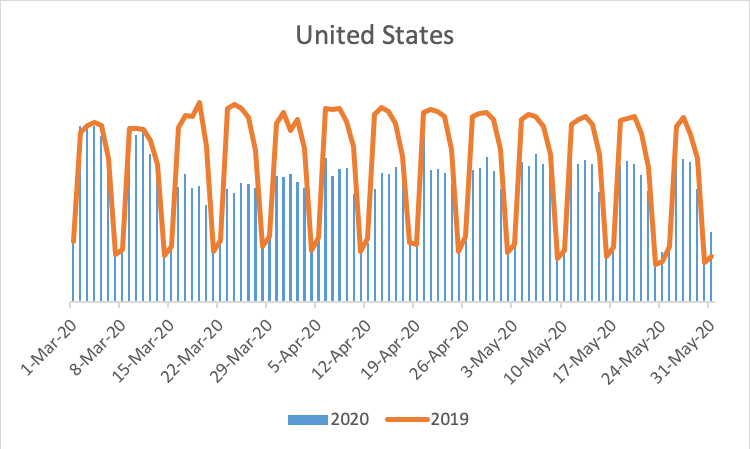
While traffic in the U.S. has recovered from its March lows it still remains off by about 10% YoY.
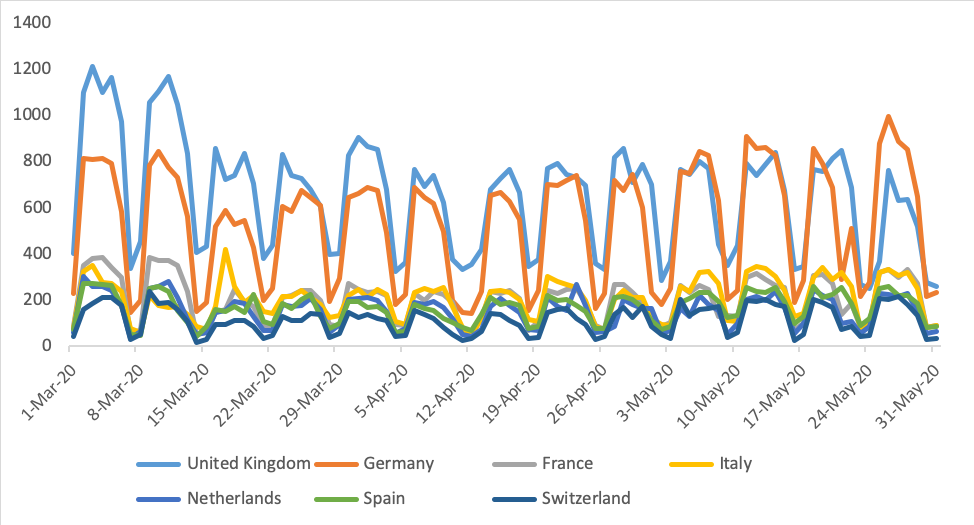
The U.K. is following a similar traffic pattern to the U.S. in that there was a sharp and significant drop-off in activity beginning mid-March that persisted through the end of May. Germany, however, has shown a gradual increase in activity to the point that it has returned to pre-pandemic levels.
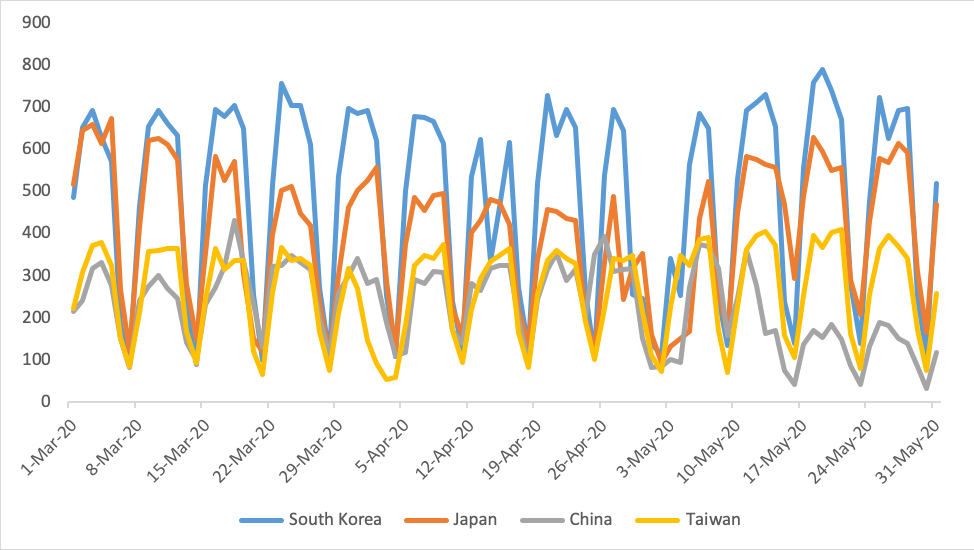
In Asia, there has been an interesting mix of behaviors. While traffic from Japan dipped the latter part of March through April it began climbing again the beginning of May and continued to do so throughout the month. Activity from South Korea and Taiwan remained robust throughout the time period and seems to still be going strong. Traffic from China, on the other hand, had been at a steady state level from March through April but began decreasing the latter part of May.
In our last online behavior article we also pointed out some areas of the site that were getting unusually high levels of attention. This included categories such as Thermal Cyclers and Real Time Thermal Cyclers as well as RNA Purification.
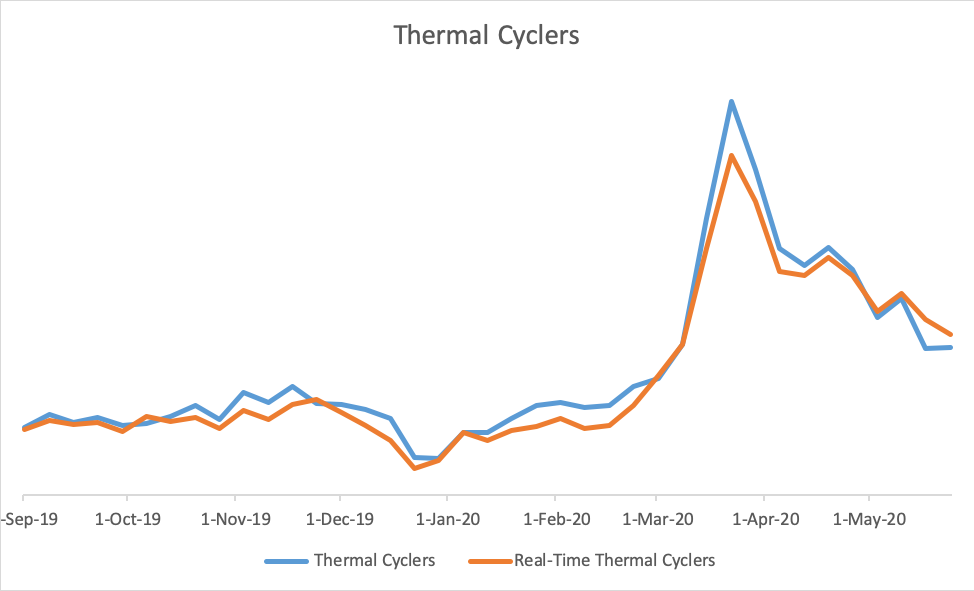
Activity to both the Thermal Cycler and Real-Time Thermal Cycler pages appeared to peak at the beginning of April but there is still a fair bit of interest in these categories.
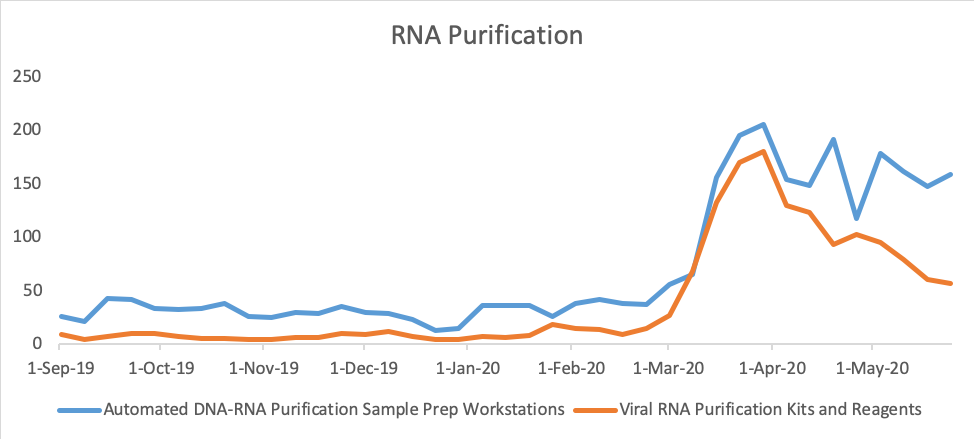
Likewise interest in RNA Purification hardware and reagents seems to have peaked with interest continuing at higher than pre-pandemic levels.
We also examined how often “coronavirus” related search terms were being used on the Biocompare website.
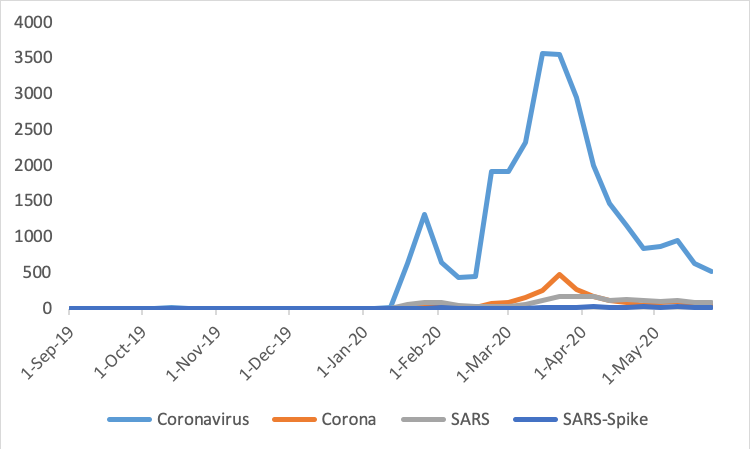
It follows the same pattern; interest peaking in April with a gradual decline in activity over time.
So, what does this all mean? We think that the gradual increase in traffic to the Biocompare website indicates that researchers are beginning to return to their labs. Activity is still not where it was pre-pandemic but it definitely increased the last half of May. The increase in activity can be seen more readily in some geographic locations than others; the U.S. still has a ways to go before we would call it “recovered” but Germany, South Korea, and Taiwan appear to be operating relatively normally. There are still some areas that appear to be lagging too; the traffic patterns in China are fundamentally different, and we will be watching them carefully.
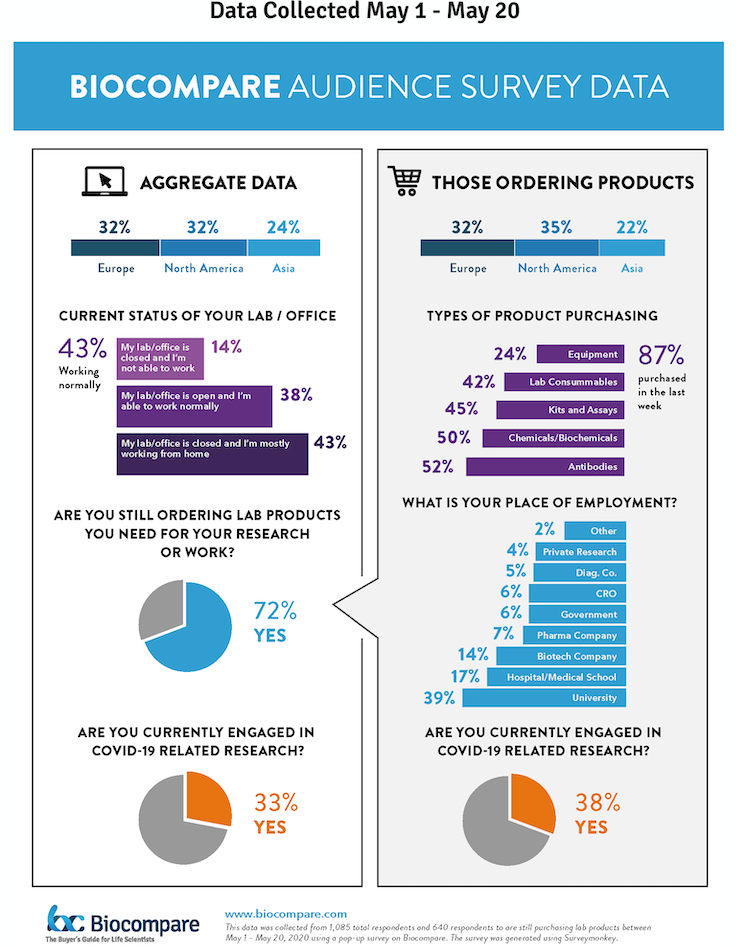
We are also seeing similar trends from the data we have been collecting from our homepage pop-up survey, as can be seen in the two infographics below. The first infographic shows data collected from March 23–April 9 and the second infographic shows data collected from May 1–May 20. Here we are seeing increases in both scientists returning to the lab, ordering products, and currently engaged in COVID-related research.
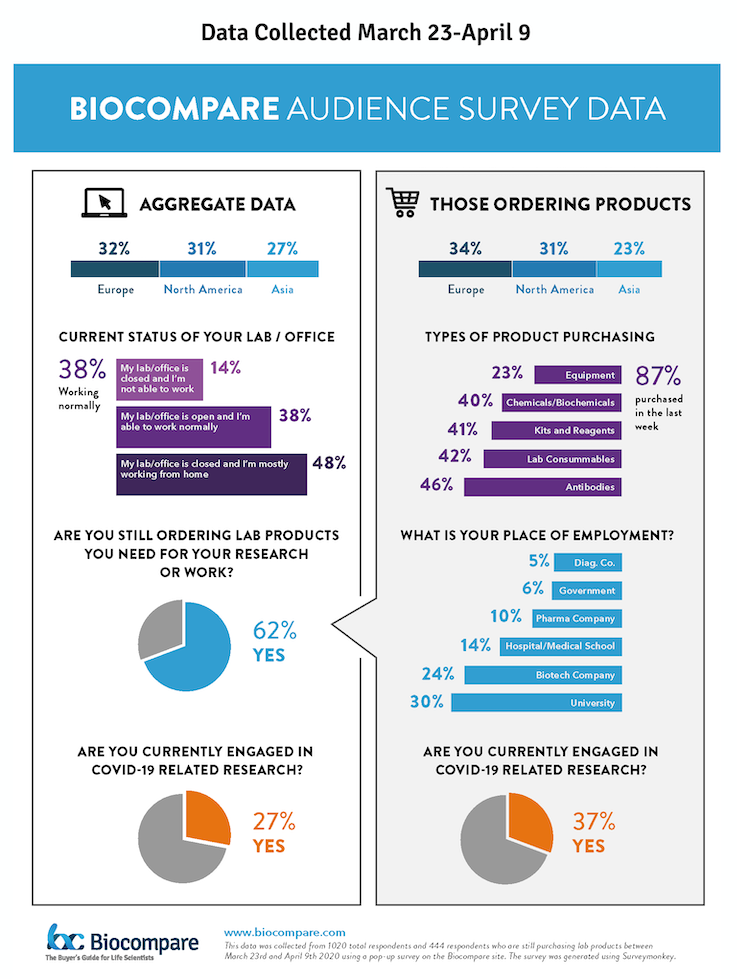
Full survey results will be available mid-June. If you would like to receive a copy of the report please email jboyce@biocompare.com.