The SARS-CoV-2 pandemic has upended life around the world. The daily habits of people everywhere have changed dramatically including how, or even if, they work. And while life science research has always felt like one area where work never stops, in this time of mandatory “shelter inplace”, it seems like even labs have gone dark.
Because Biocompare is primarily a resource for people to source products, we feel that our traffic can be used as a proxy for how much purchasing, and hence research, is going on during this historic period. So we’ve pulled together some data that includes information about our website traffic along with the results of a short survey we administered to visitors of the Biocompare website. Here’s what we found:
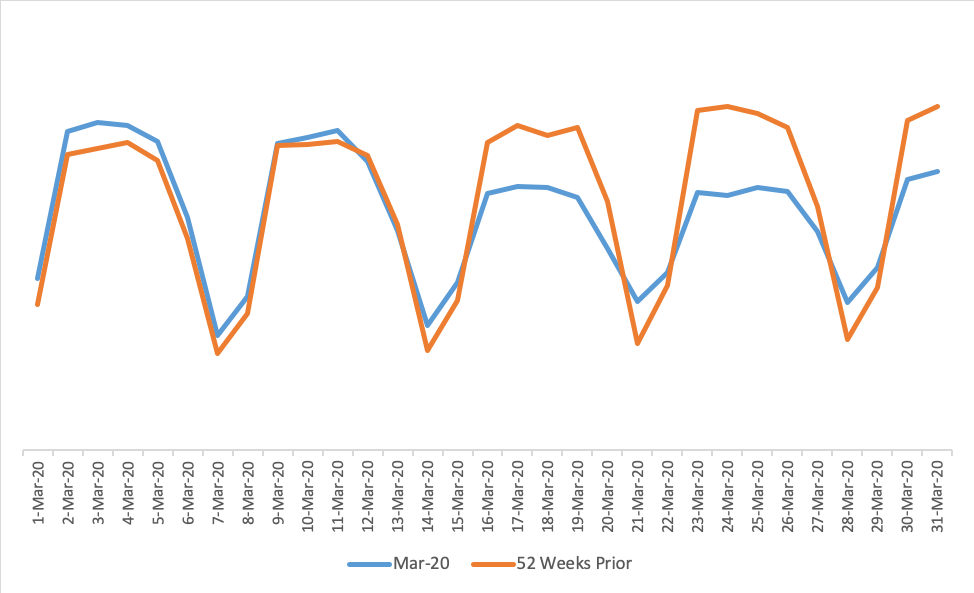
Visits for the month of March were up 8.2% year over year from March 1–15. From March 16–31 visits decreased by -15.1%.
But not every region of the world showed the same traffic patterns.
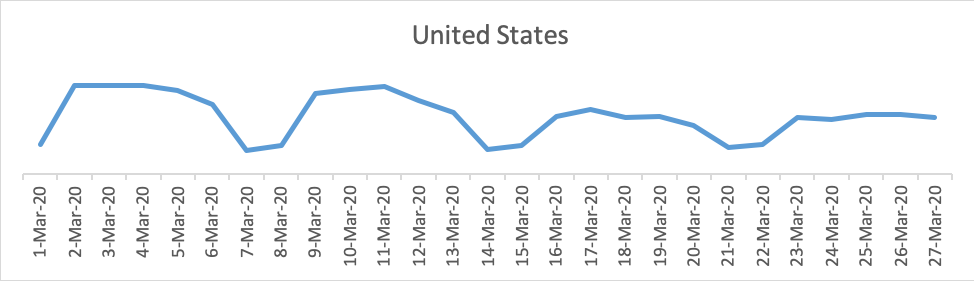
In the United States, visits dropped 23% from March 15–27 compared with the same period the previous year.
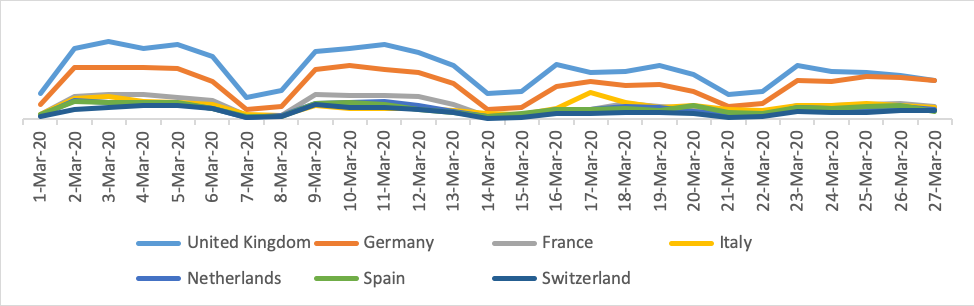
In the UK and Germany, similar patterns were seen.
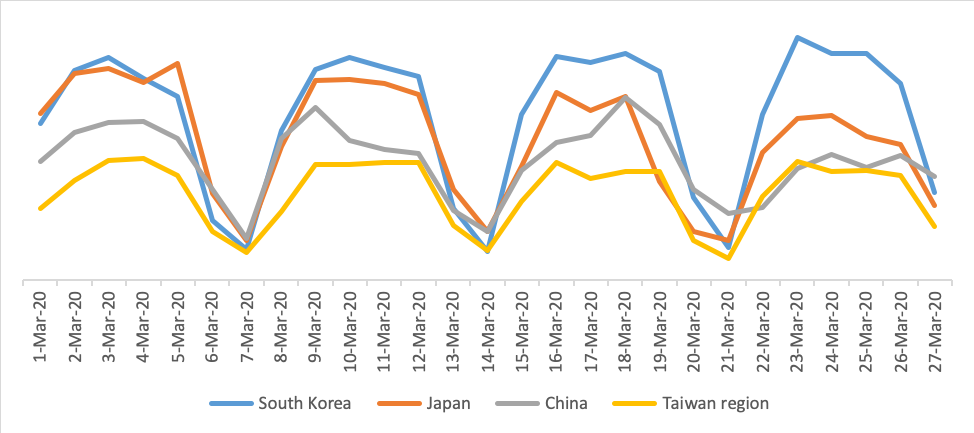
But in Asia, a different pattern appeared. South Korea and Taiwan both showed strong traffic throughout the month of March. Both China and Japan had small decreases in visits during the last 2 weeks of March but the dip was much smaller than what was seen in the U.S. and EU.
And while traffic overall slowed in March, activity to some areas of the site increased significantly:
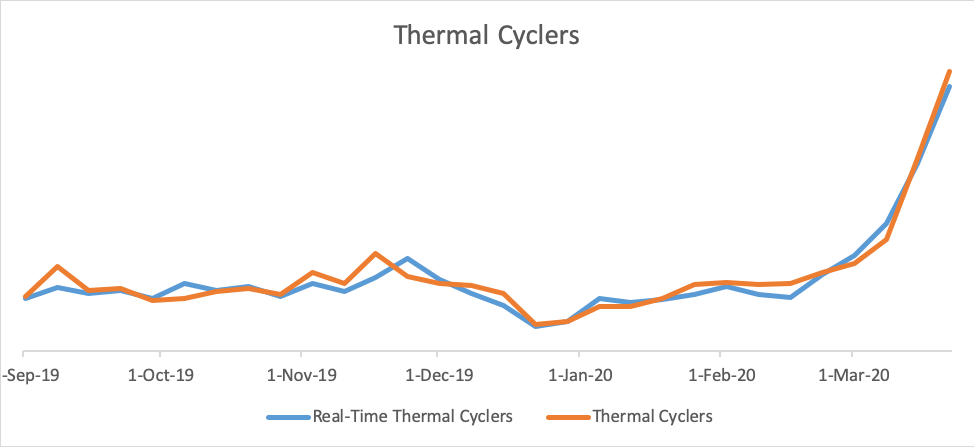
Interest in Real-Time Thermal Cyclers and Thermal Cyclers began increasing toward the end of February, and activity remained 4x higher than normal during the month of March.
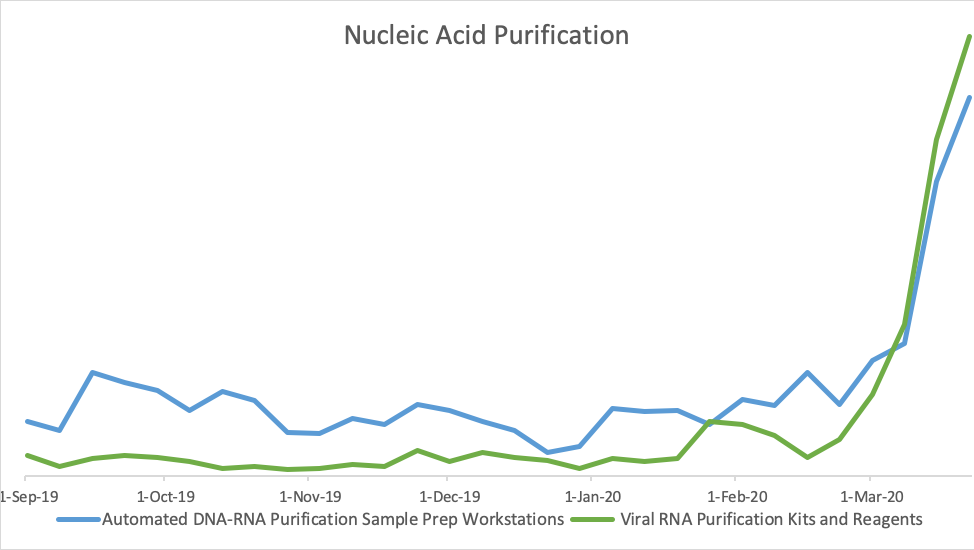
Similarly, interest in Automated DNA-RNA Purification Sample Preparation Workstations and Viral RNA Purification Kits spiked in late February and remained high throughout March reaching levels 4–5 times greater than normal for Automated Workstations and 10 times greater for Viral RNA Purification Kits.
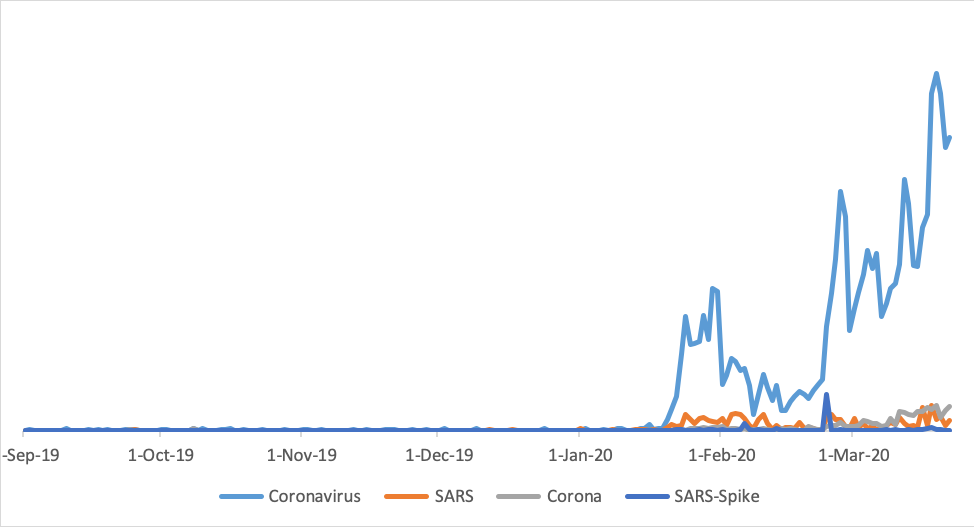
There has also been a spike in Coronavirus-related search terms on the site.
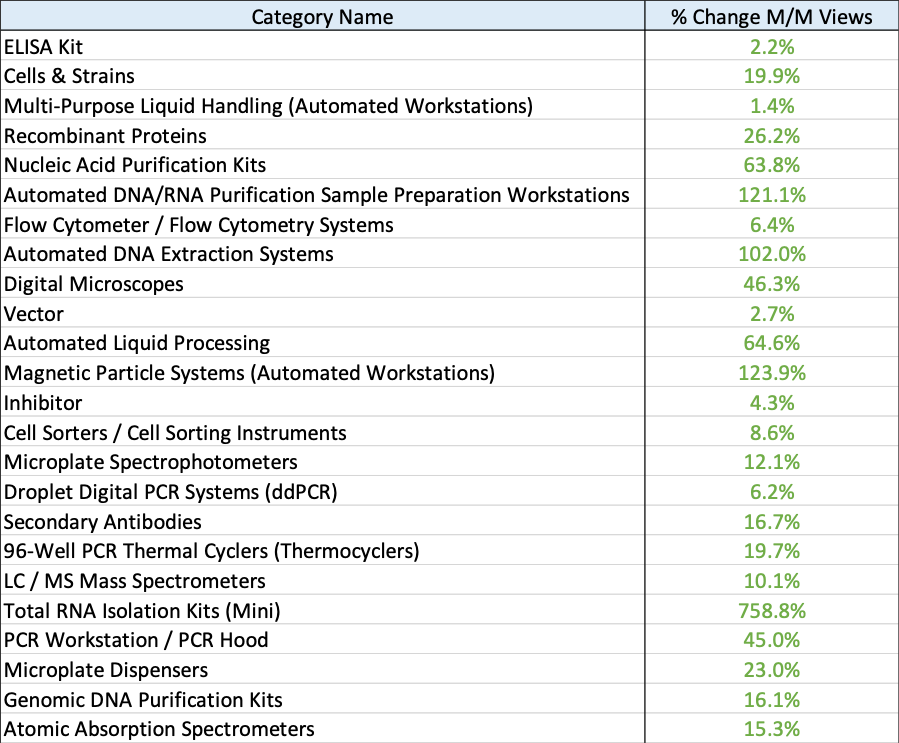
But not all of the uptick in interest in products on the site is necessarily related to the Coronavirus. Here is an example of some of the categories that saw an increase in page views during the month of March (compared to February).
From March 27 through April 9, visitors to the Biocompare website were surveyed about the status of their lab work and product purchasing plans. A summary of this data, from 1,020 respondents, is shown below.
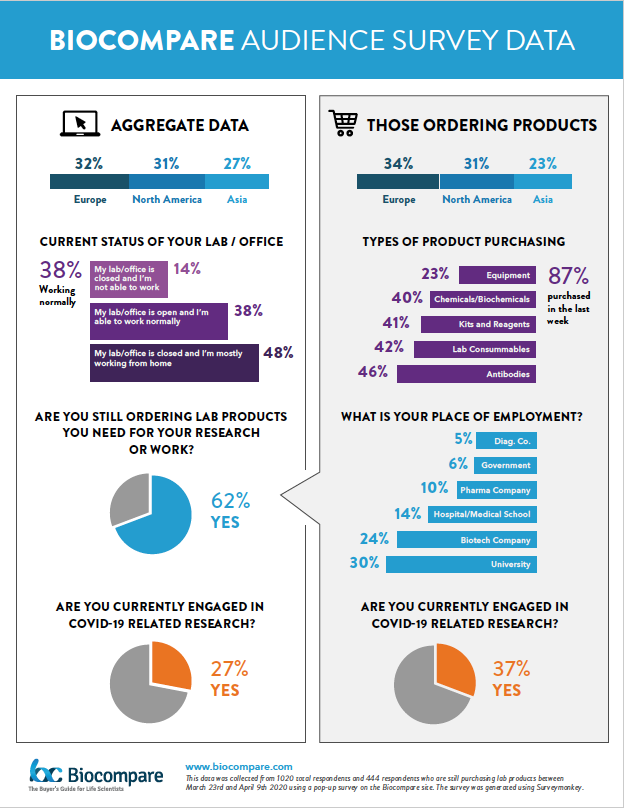
Survey respondents were split almost equally between Europe and North America at 32% and 31% respectively with 27% coming from Asia. Of these researchers, 38% are currently working “normally” and 48% “working from home”. Interestingly, 63% of respondents were still ordering products for their labs. Of these, 87% had purchased products within the previous week. A breakdown of the products ordered as well as the institution types can be found in the infographic above.
Taken together this data indicates that while user behaviors have changed during these extraordinary times it does seem that research is pressing on. A significant number of scientists appear to be searching for products and, when surveyed, say they are still ordering. Because these numbers are backward-looking and not necessarily predictive of the future it’s difficult to say whether or not these trends will hold. But they do seem to indicate that, at least at some level, research is moving forward.